03 Introduction to Python III — Functions
25 Jan 2018We are continuing from
the previous lesson in the "work directory"
~/PHY494/03_python. We will use ipython and your text editor.
Functions
Functions package re-useable code and generalize code by allowing variable inputs. Writing code with functions is essential for debugging and reusability. If you have, say, 10 lines of code (or even less) that do something specific, consider making it a function.
Basic structure a of a python function
def func_name(arg1, arg2, ...):
    """documentation string (optional)"""
    # body
    ...
    return results
Repackage our step function:
# Heaviside step function

def heaviside(x):
   """Heaviside step function"""

   theta = None
   if x < 0:
      theta = 0.
   elif x == 0:
      theta = 0.5
   else:
      theta = 1.

   return theta
When you run it… then nothing happens: The function was defined but not called.
Now add at the end of heaviside.py
x = 3
theta = heaviside(x)

print("Theta(" + str(x) + ") = " + str(theta))
and run it. Now the function is being called (theta = heaviside(x))
and its return value assigned to the variable theta.
Activity: create functions
- create a file
myfuncs.py - add
heaviside()to the file - add a function
fahrenheit2kelvin()to convert from Fahrenheit to Kelvin 1 - add a function
kelvin2celsius()to convert from Kelvin to Celsius (subtract 273.15).
Try out your functions (in ipython):
%run myfuncs.py

heaviside(5)
fahrenheit2kelvin(100)
kelvin2celsius(300)

kelvin2celsius(fahrenheit2kelvin(100))
should give 2
1.0
310.92777777777775
26.850000000000023
37.77777777777777
Activity: Plotting the step function
Perform this activity using pair programming3.
Use what you learnt about loops and
functions to plot the Heaviside step function. Create a
program step_plot.py that
- defines the Heaviside step function
(use
heaviside(x)from above); - generates a list of values
[-4, -3.5, -3, ..., 0, 0.5, 1, 1.5, ... 4]; - evaluates for all values and stores the results in a list;
- prints the lists of and values; it should look
like
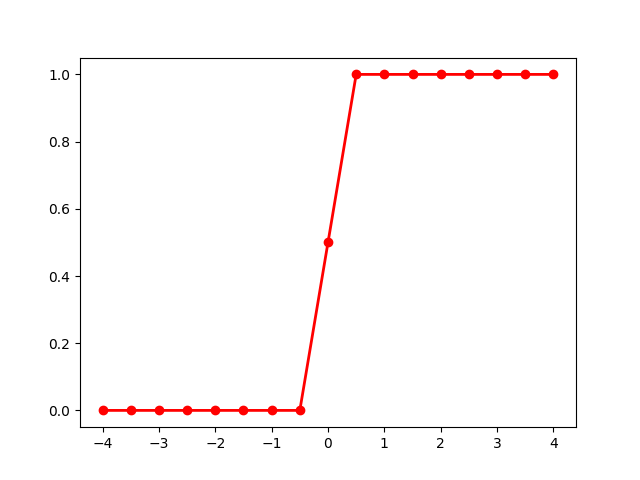
-4.0 0.0 -3.5 0.0 ... 3.5 1.0 4.0 1.0 - BONUS: plots against ; see the Basic Plotting example, namely you can use code like
   import matplotlib.pyplot as plt
   plt.plot(xvalues, thetas, '-o', color="red", linewidth=2)
   plt.show()
Does your graph look the way that you expect it? 4

Footnotes
-
You can compare your solution to myfuncs.py. ↩
-
We will try a software engineering technique called pair programming (borrowed from agile/extreme programming)
- Split into teams of 2. (Be nice. Introduce yourselves.)
- Sit next to each other at one desk.
- Decide whose laptop you are going to use.
- Flip a coin to decide who will start out as the navigator and who will be the driver.
- Roles:
- driver: keyboard & types
- navigator reads code, provides directions, catches bugs
- Both constantly talk to each other: comment on what you're typing, comment on what is being typed
- Switch roles every ~5 minutes
-
You can compare your solution to step_plot.py. ↩